
Reconstruction using API#
When you have multiple scans, you might want to automate a workflow. Instead of opening your scans one by one inside the GUI, you can also use openalea.plantgl functions in combination with openalea.plantscan3d api.
All the steps for reconstruction are available in the reconstruction page.
📝 Note
openalea.plantscan3dis a GUI-first tool for editing point cloud and perform reconstruction. Right now, the API is not as complete and fully-featured as the GUI. It is here to help user that need to perform batch treatment or perform a quick reconstruction. Please raise an issue on the official github repository if you need more features.
We first import the necessary openalea.plantscan3d and openalea.plantgl dependencies that will be used in the reconstruction and visualization.
[1]:
import glob
import os
from pathlib import Path

from importlib.resources import files, as_file
from openalea.plantscan3d.processmtg import (
    determine_radius, generate_mtg, trunk_lateral_axes,
    trunk_direction, trunk_radii, trunk_length,
    trunk_branching_zone_start, trunk_branching_zone_end, trunk_branching_zone_length,
    axis_length, axis_chord_length, axis_subpart_angle, axis_extremities_angle,
    retrieve_axis_radii
)
from openalea.plantscan3d.processpoints import (
    filter_points, load_points, skeleton, subsample
)
from openalea.plantscan3d.visualization import (
    view, view_points,
    mtg_to_scene, nodemtg_to_scene, points_to_scene
)
from openalea.plantscan3d.mtgmanip import gaussian_filter, pipemodel
from openalea.plantscan3d.serial import writeMTGfile, convertToStdMTG, writefile
from openalea.plantscan3d.xumethod import xu_method
from openalea.plantscan3d.livnymethod import livny_method_mtg

from openalea.plantgl.all import Scene, contract_point3
from openalea.plantscan3d.mtgmanip import gaussian_filter
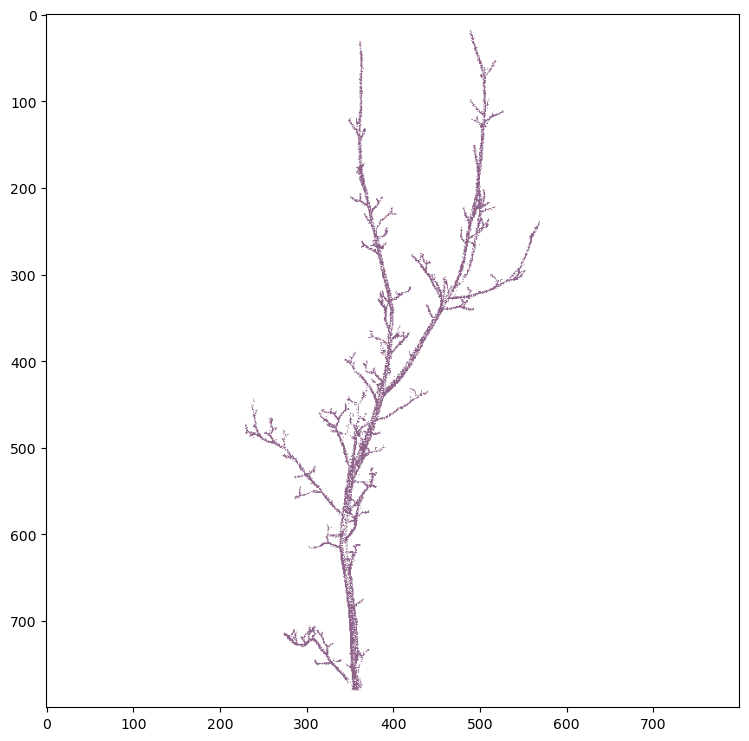
Load the point cloud#
You can now load any point cloud and visualize quickly the points distribution.
[2]:
datadir = files('openalea.plantscan3d.data.scans_example')
points = load_points(str(datadir / 'A3B4.asc'))
view_points(points)
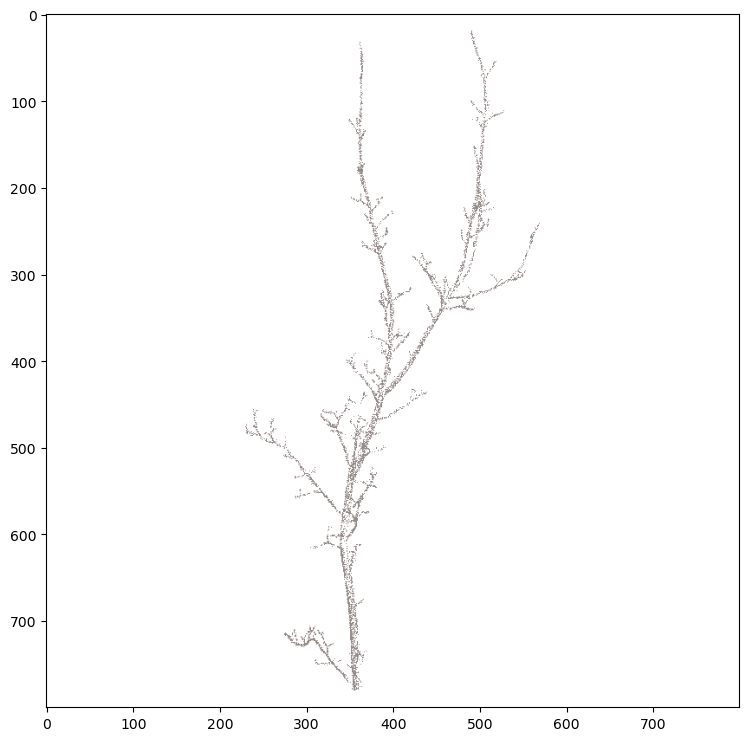
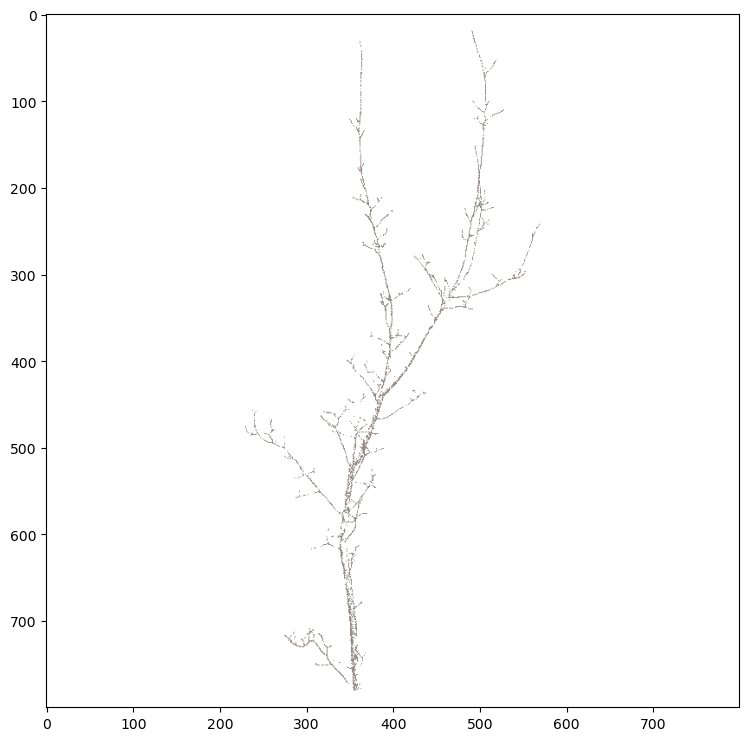
Points filtering and contraction#
We can now perform the filtering / contraction and display the result.
[3]:
# If you want to subsample the points
points = subsample(points, 10000)
points = filter_points(points)
view_points(points)

# You can also perform point contraction
cpoints = contract_point3(points, 0.03)
view_points(cpoints)
Nb points processed 10000 (100.00%) [left : 0 (0.00%)].
Density computed for 75.80% of points.oints.
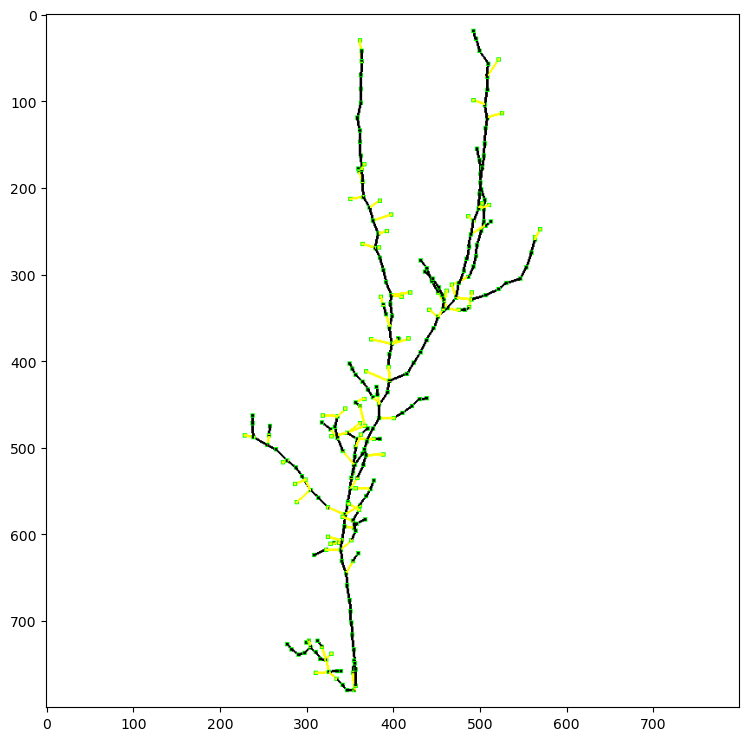
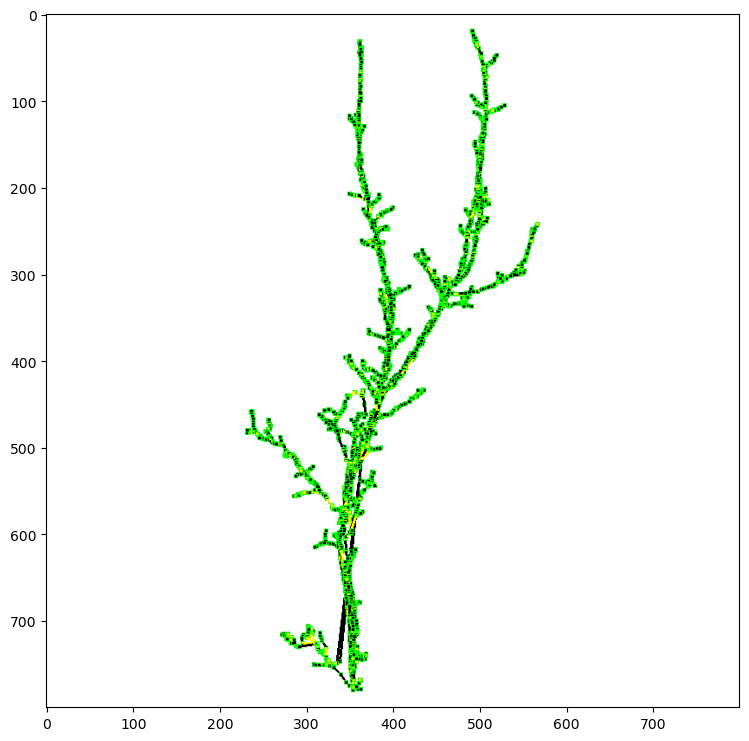
Topology reconstruction#
We can do topology reconstruction, using different algorithms. Please check the api documentation for input parameters to the skeleton function.
[4]:
# Xu reconstruction method
binratio = 50
k = 20
mtg_xu = skeleton(points, skel_func=xu_method, xu_binratio=binratio, xu_neighbors=k)
view(nodemtg_to_scene(mtg_xu))

# Liivny reconstruction method
nb_contraction = 3
nb_filtering = 5
min_edge_ration = 0.15
mtg_livny = skeleton(points, skel_func=livny_method_mtg, livny_contraction_nb=nb_contraction, livny_filtering_nb=nb_filtering, livny_min_edge_ratio=min_edge_ration)
view(nodemtg_to_scene(mtg_livny))

# You can smooth the positions
gaussian_filter(mtg_xu, "position")
view(nodemtg_to_scene(mtg_xu))
Generate point color : 100.00%Compute Remanian graph.
Connect all components of Riemanian graph.
Nb points processed 9945 (100.00%) [left : 0 (0.00%)].
Compute distance to root.
Compute cluster according to distance to root.
Nb of groups : 252
Compute adjacency graph of groups.
Compute centroid of groups.
Compute spanning tree of groups.
Remove short nodes
average distance to points : 0.006637546199244899
compute radii
edge length characterization
Filter nodes 0.013287846853155805
Percentage short node filtered : 44.83660130718954 ( 4459 )
Filtering : pass 1
similar nodes detected : 163
Nb of merges : 163
Percentage filtered : 4.174261757200146
recompute weights
average distance to points : 0.006968764531160445
recompute radii
Filtering : pass 2
similar nodes detected : 43
Nb of merges : 43
Percentage filtered : 0.9511128019783146
recompute weights
average distance to points : 0.006966988192156835
recompute radii
Filtering : pass 3
similar nodes detected : 21
Nb of merges : 21
Percentage filtered : 0.4417130785481083
recompute weights
average distance to points : 0.006965890167048571
recompute radii
Filtering : pass 4
Nb points processed 9676 (97.30%) [left : 269 (2.70%)].
Nb points processed 9711 (97.65%) [left : 234 (2.35%)].
Nb points processed 9770 (98.24%) [left : 175 (1.76%)].
Nb points processed 9843 (98.97%) [left : 102 (1.03%)].
Nb points processed 9872 (99.27%) [left : 73 (0.73%)].
Nb points processed 9895 (99.50%) [left : 50 (0.50%)].
Nb points processed 9945 (100.00%) [left : 0 (0.00%)].
Nb points processed 9616 (96.69%) [left : 329 (3.31%)].
Nb points processed 9651 (97.04%) [left : 294 (2.96%)].
Nb points processed 9680 (97.34%) [left : 265 (2.66%)].
Nb points processed 9739 (97.93%) [left : 206 (2.07%)].
Nb points processed 9770 (98.24%) [left : 175 (1.76%)].
Nb points processed 9843 (98.97%) [left : 102 (1.03%)].
Nb points processed 9872 (99.27%) [left : 73 (0.73%)].
Nb points processed 9895 (99.50%) [left : 50 (0.50%)].
Nb points processed 9926 (99.81%) [left : 19 (0.19%)].
Nb points processed 9945 (100.00%) [left : 0 (0.00%)].
Nb points processed 9616 (96.69%) [lesimilar nodes detected : 12
Nb of merges : 12
Percentage filtered : 0.23148148148148148
recompute weights
ft : 329 (3.31%)].
Nb points processed 9651 (97.04%) [left : 294 (2.96%)].
Nb points processed 9680 (97.34%) [left : 265 (2.66%)].
Nb points processed 9739 (97.93%) [left : 206 (2.07%)].
Nb points processed 9770 (98.24%) [left : 175 (1.76%)].
Nb points processed 9843 (98.97%) [left : 102 (1.03%)].
Nb points processed 9872 (99.27%) [left : 73 (0.73%)].
Nb points processed 9895 (99.50%) [left : 50 (0.50%)].
Nb points processed 9926 (99.81%) [left : 19 (0.19%)].
Nb points processed 9945 (100.00%) [left : 0 (0.00%)].
faverage distance to points : 0.006965700873817996
recompute radii
Filtering : pass 5
fsimilar nodes detected : 61% of nodes.
Nb of merges : 6
Percentage filtered : 0.13534416086620263
recompute weights
faverage distance to points : 0.006961263183641898
recompute radii
filtering coRemove short nodes  1835,4564,2813

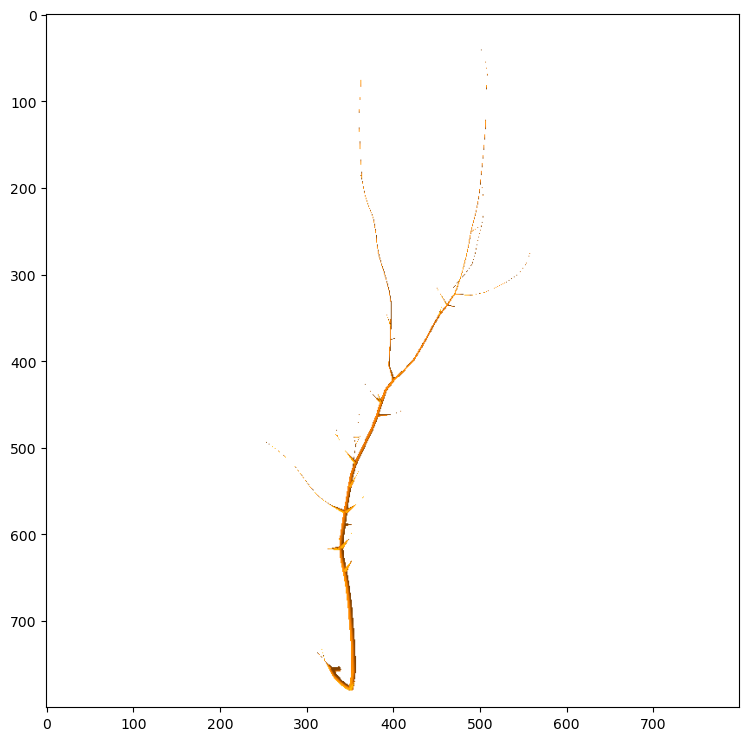
And finally we determine the radius property of the MTG.
[5]:
determine_radius(mtg_xu, points)
# You can also smooth the radius
gaussian_filter(mtg_xu, "radius", False)
view(mtg_to_scene(mtg_xu))
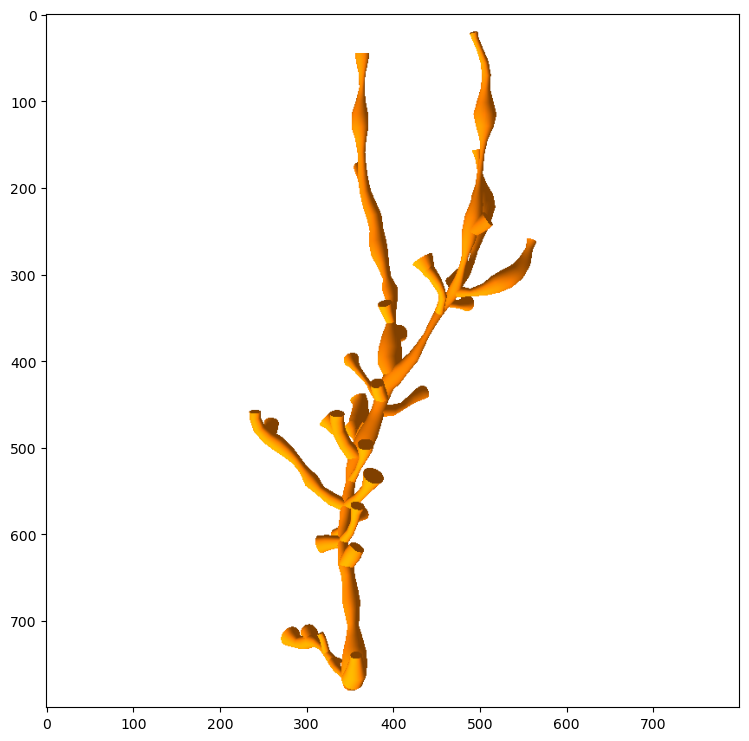
This doesn’t look so good. We’ll apply the pipe model to obtain a more realistic estimation of the radius.
[6]:
from openalea.plantscan3d.mtgmanip import pipemodel, get_first_param_value
# We need to define "root" and "leaf" radii for the pipe model
# Here we define "root" as the first node, but you can also set the id of any node
pipemodel_radii = pipemodel(mtg_xu)
mtg_xu.property("radius").update(pipemodel_radii)
view(mtg_to_scene(mtg_xu))
2 253
0.8322512260106805
Save reconstructed MTG#
[7]:
writeMTGfile("A3B4_reconstructed_xu.mtg", convertToStdMTG(mtg_xu))
Automatic processing of the scans#
We can now do some automatic processing and analyses of multiple scans. Here we detail the implementation of the {py:func}openalea.plantscan3d.api.processmtg.characterize_mtg:
[8]:
def characterize_mtg(g):
    # Get the lists of short and long lateral axes.
    shortaxis, longaxis = trunk_lateral_axes(g)
    # Determine the trunk direction.
    trunk_dir = trunk_direction(g, 0.5)
    # Determine the trunk radius at the base and the at top.
    trunkbaseradius, trunktopradius = trunk_radii(g, 0.1, 0.1)

    res = dict(
        # Determine the length of the trunk.
        trunk_length = trunk_length(g),
        # Determine the start of the trunk branching zone.
        trunk_branching_zone_start = trunk_branching_zone_start(g),
        # Determine the end of the trunk branching zone.
        trunk_branching_zone_end = trunk_branching_zone_end(g),
        # Determine the length of the trunk's branching zone.
        trunk_branching_zone_length = trunk_branching_zone_length(g),
        trunk_base_radius = trunkbaseradius,
        trunk_top_radius = trunktopradius,
        nb_short_axis = len(shortaxis),
        nb_long_axis = len(longaxis),
    )

    bot_angle_param = 0, 0.15
    top_angle_param = 0.85, 1

    # Determine the length of each long axis.
    res.update([('axis1_length_'+str(i),axis_length(g,l)) for i,l in enumerate(longaxis)])
    # Determine the chord length of each long axis.
    res.update([('axis1_chord_length_'+str(i),axis_chord_length(g,l)) for i,l in enumerate(longaxis)])
    # Determine the angle between the trunk and the bottom of each long axis.
    res.update([('axis1_angle_bot_'+str(i),axis_subpart_angle(g, l, bot_angle_param[0], bot_angle_param[1], trunk_dir)) for i,l in enumerate(longaxis)])
    # Determine the angle between the trunk and the top of each long axis.
    res.update([('axis1_angle_top_'+str(i),axis_subpart_angle(g, l, top_angle_param[0], top_angle_param[1], trunk_dir)) for i,l in enumerate(longaxis)])
    # Determine the angle between the trunk and the extremities of each long axis.
    res.update([('axis1_extremities_angle_'+str(i),axis_extremities_angle(g, l, trunk_dir)) for i,l in enumerate(longaxis)])
    for i,l in enumerate(longaxis):
        rfirst, rmedian, rlast = retrieve_axis_radii(g,l)
        # Determine the radius of the first node of the axis.
        res['axis1_rfirst_'+str(i)] = rfirst
        # Determine the radius of the last node of the axis.
        res['axis1_rlast_'+str(i)] = rlast
        # Determine the mean value of the radius of the axis.
        res['axis1_rmedian_'+str(i)] = rmedian
    return res
And we handle multiple scans at the same time:
[9]:
def aggregate_df(dfs):
    import pandas as pd
    # Check if we have at least one dataframe
    assert len(dfs) > 0
    props = set(dfs[0][1].keys())
    for v in dfs:
        props |= set(v[1].keys())
    resagg = dict(name= [v[0] for v in dfs])
    for propname in props:
        resagg[propname] = [v[1].get(propname) for v in dfs]
    df = pd.DataFrame.from_dict(resagg)
    return df

def process_all(filenames):
    # check number of txt files to process
    assert len(filenames) > 0
    res = []
    for filename in filenames:
        print ('process',filename)
        mtg = generate_mtg(filename, subsample={"ptsnb":10000})
        mtgfile = os.path.splitext(filename)[0]+'.bmtg'
        writefile(mtgfile,mtg)
        res.append((os.path.basename(filename), characterize_mtg(mtg)))
    df = aggregate_df(res)
    df = df[sorted(df.columns.values)]
    df.to_csv('results.csv')
    return df
[10]:
datadir = files('openalea.plantscan3d.data.pointset')
with as_file(datadir) as p:
    filenames = glob.glob(os.path.join(Path(p),'puu*.bgeom'))
    print(filenames)
    df = process_all(filenames)
print(df)
['/var/folders/v1/6y176c8d2jz06qr8rd3jq_480000gn/T/tmp7nleqn2_/pointset/puu1.bgeom', '/var/folders/v1/6y176c8d2jz06qr8rd3jq_480000gn/T/tmp7nleqn2_/pointset/puu3.bgeom']
process /var/folders/v1/6y176c8d2jz06qr8rd3jq_480000gn/T/tmp7nleqn2_/pointset/puu1.bgeom
Nb points processed 10000 (100.00%) [left : 0 (0.00%)].
Density computed for 100.00% of points.Compute Remanian graph.
Connect all components of Riemanian graph.
Nb points processed 5770 (98.65%) [left : 79 (1.35%)].
Nb points processed 5849 (100.00%) [left : 0 (0.00%)].
Compute distance to root.
Compute cluster according to distance to root.
Nb of groups : 560
Compute adjacency graph of groups.
Compute centroid of groups.
Compute spanning tree of groups.
Remove short nodes
2 561
0.7275471153823021
process /var/folders/v1/6y176c8d2jz06qr8rd3jq_480000gn/T/tmp7nleqn2_/pointset/puu3.bgeom
Nb points processed 10000 (100.00%) [left : 0 (0.00%)].
Density computed for 100.00% of points.Compute Remanian graph.
Connect all components of Riemanian graph.
Nb points processed 9034 (100.00%) [left : 0 (0.00%)].
Compute distance to root.
Compute cluster according to distance to root.
Nb of groups : 907
Compute adjacency graph of groups.
Compute centroid of groups.
Compute spanning tree of groups.
Remove short nodes
2 908
0.6761128994954333
   axis1_angle_bot_0  axis1_angle_bot_1  axis1_angle_bot_10  \
0          23.169384          83.487019                 NaN
1         156.706087         121.810382           98.808021

   axis1_angle_bot_11  axis1_angle_bot_12  axis1_angle_bot_13  \
0                 NaN                 NaN                 NaN
1            44.80624          107.954698          106.102064

   axis1_angle_bot_14  axis1_angle_bot_15  axis1_angle_bot_16  \
0                 NaN                 NaN                 NaN
1           18.755609           90.234573           61.971211

   axis1_angle_bot_17  ...  axis1_rmedian_9        name  nb_long_axis  \
0                 NaN  ...              NaN  puu1.bgeom             9
1           28.605433  ...         0.109428  puu3.bgeom            24

   nb_short_axis  trunk_base_radius  trunk_branching_zone_end  \
0              0          55.321680                         0
1              0          10.942832                         0

   trunk_branching_zone_length  trunk_branching_zone_start  trunk_length  \
0                            0                  252.185910    447.892331
1                            0                   40.834999   1630.550546

   trunk_top_radius
0         46.128572
1          5.677140

[2 rows x 201 columns]